Introduction
In this article I would like to show you arbitrage strategy in which basic assumption is that we would like to avoid expensive withdrawals as we did it in the basic arbitrage. We start the trade when the price on the exchange A is lower than on the exchange B, we wait until the price on the exchange A is higher than on the exchange B and we do the trade in the opposite direction. This strategy is very useful for the bullish times when the prices between exchanges vary a lot and they are flipping couple times a day.
Strategy basics
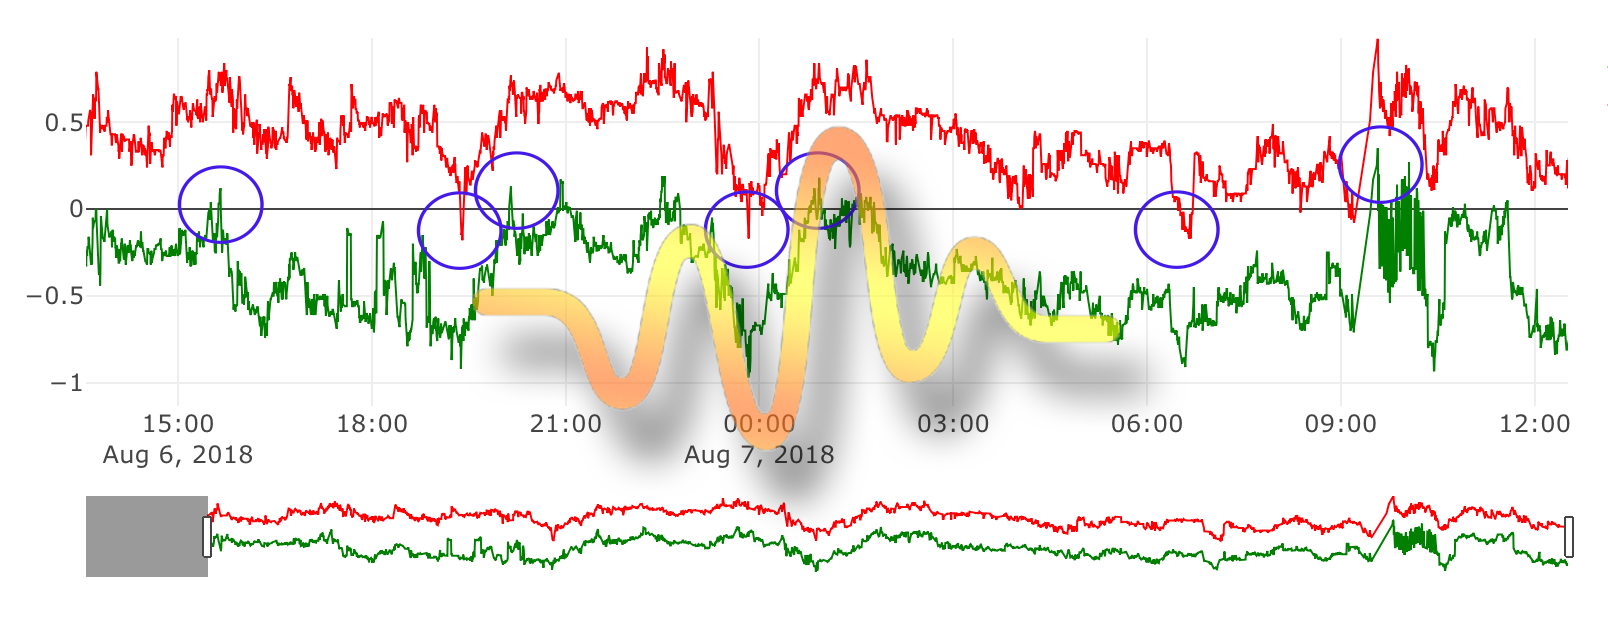
Please take a look at the charts representing prices of the LTC/BTC on YoBit and Binance on Aug 6-7th, 2018.
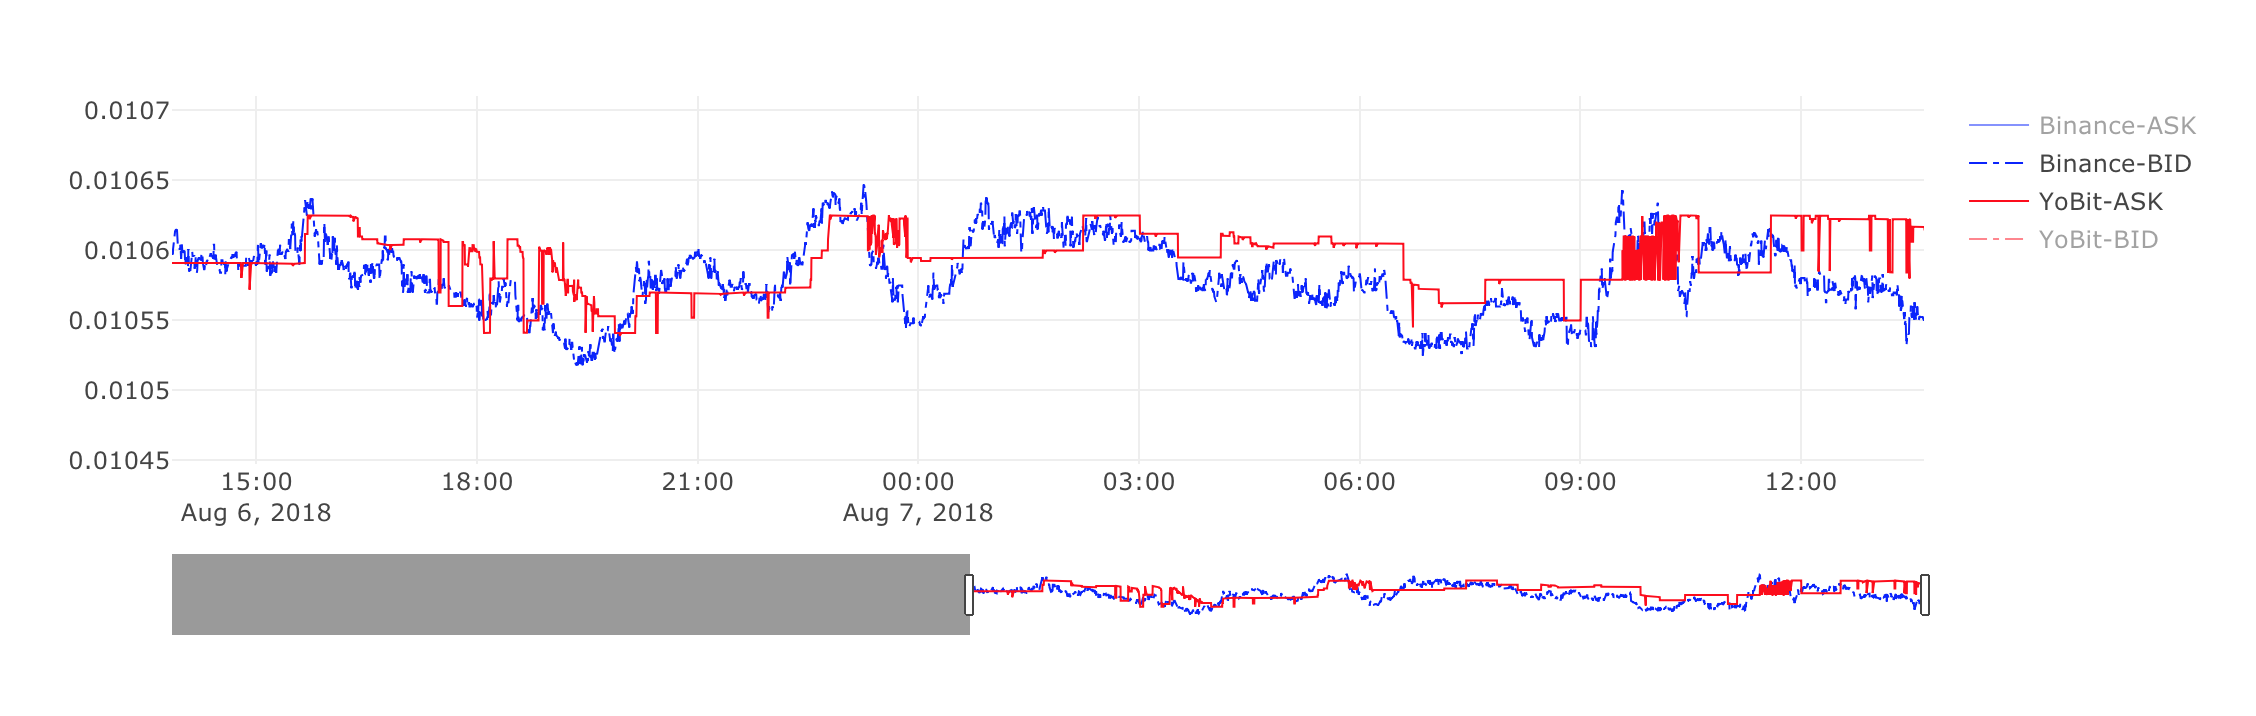
The chart above shows ticker bid price on Binance and ticker ask price on Yobit. It is interesting if we want to buy on YoBit and sell on Binance. All the places where the red line is below the blue line are potential arbitrage opportunities. This chart doesn’t show the commissions nor doesn’t look into depth of the order book.
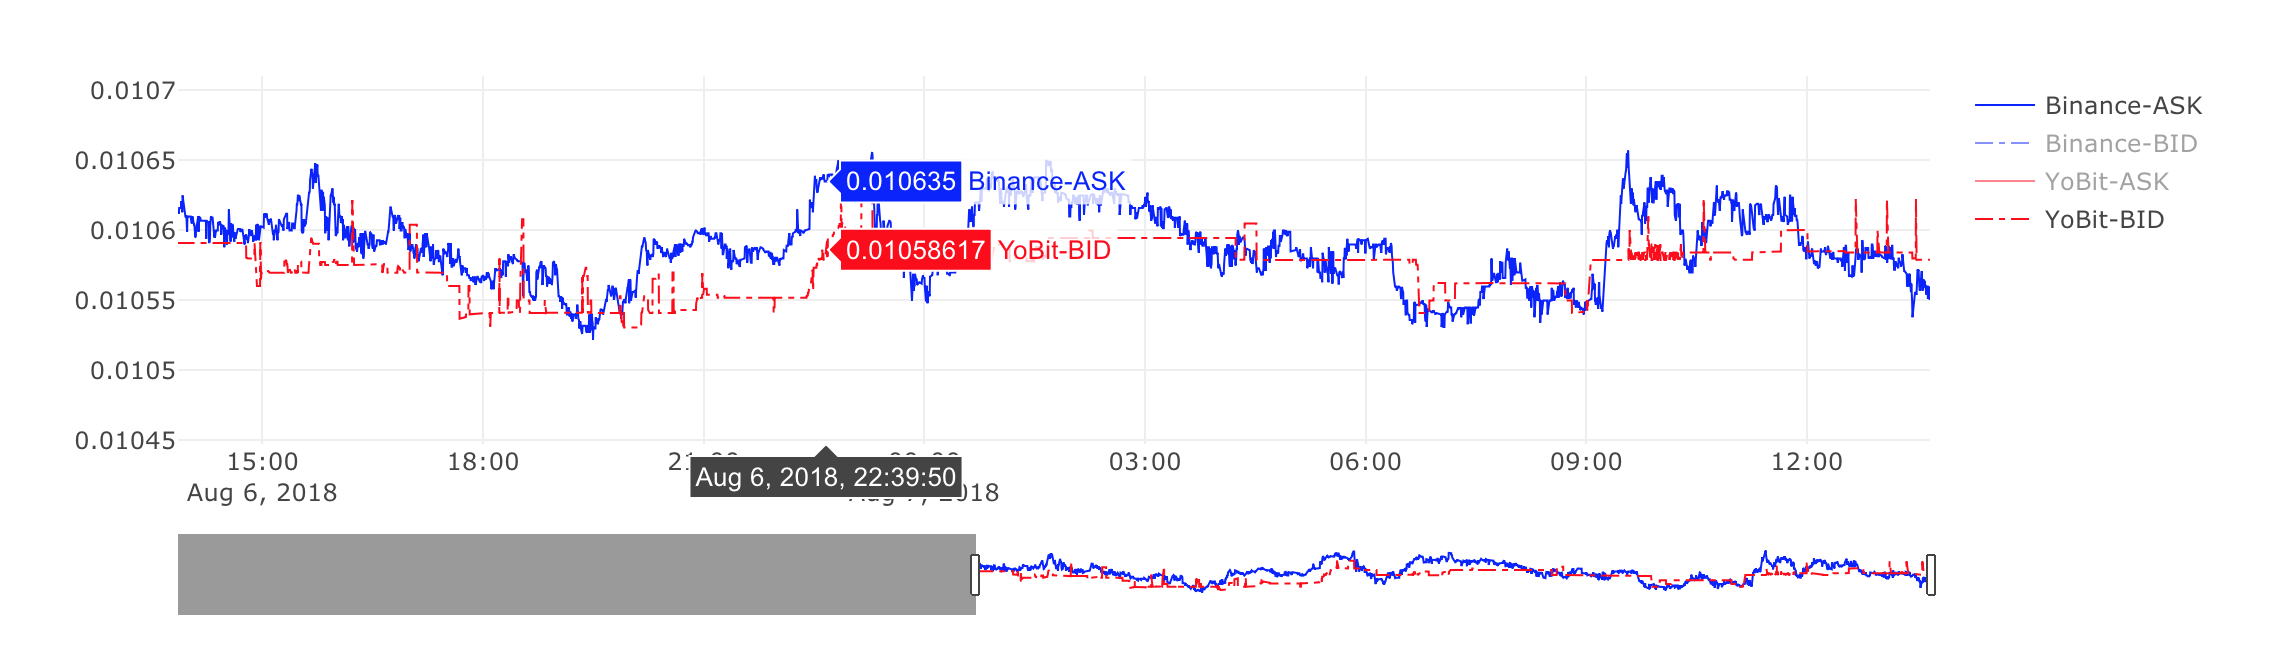
This chart in turn shows the bid price on YoBit and ask price on Binance. It is interesting if we want to buy on Binance and sell on YoBit – that is the opposite direction than the first analysis.
Now let’s take a look at this chart representing the arbitrage analysis.
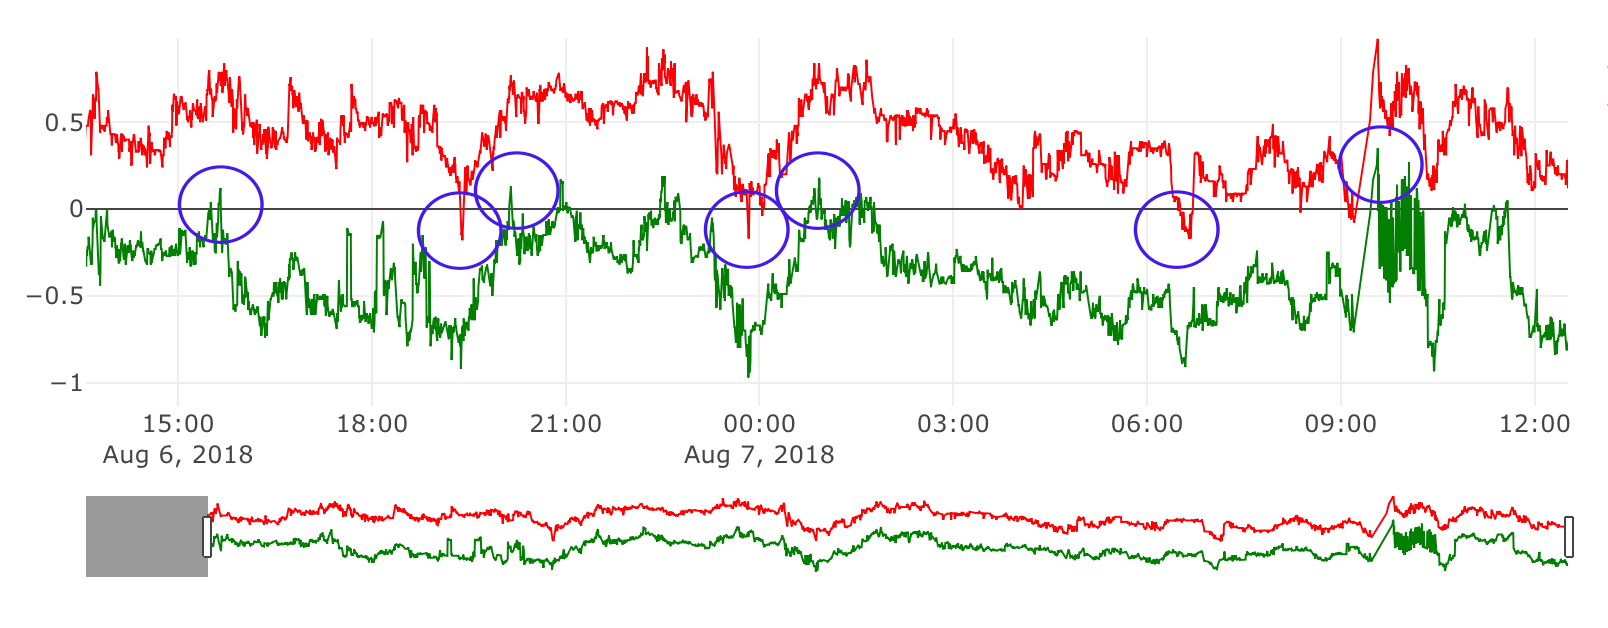
MultiTrader platform has performed cross-exchange order book matching for all the order books gathered throughout the day from YoBit and Binance for LTC/BTC. The analysis has been performed with the assumption that the trade size would be 0.75 LTC – that is around 50 USD. Y-axis of this chart is % of gain on the arbitrage trade. Green line represents the gain % in the direction from YoBit to Binance (buy on YoBit, sell on Binance). Red line represents the loss value for the trades that would be made in the opposite direction (buy on Binance, sell on Yobit).
This is a bit tricky, so let’s stop here for a second. MultiTrader platform draws loss as a positive value as this is very convenient for another arbitrage method – Spread Trading. MultiTrader arbitrage analysis charts always have two lines – one representing the gain percent in the direction that we chose as the base – in this case it is buy on YoBit, sell on Binance. Second, red line represents the negative value of gain percent – that is loss percent – for the trades that would be made in the opposite direction. That is in this case buy on Binance, sell on YoBit. As the value of gain in the opposite direction is usually negative I call it a loss. As I’ve called it a loss, I can draw this as a positive value. That is why the red line is above 0. It just means that the value of loss is above 0 for all the trades in the Binance->YoBit direction. In case the red line goes below 0, that means that the loss is negative – that actually means that the gain in the Binance->YoBit direction is positive!
So if we look closely, we have following gains (marked with blue circle on the chart)
- gain on Yobit – Binance at 15:40 on Aug 6th: 0.12%
- gain on Binance – Yobit at 19:20 on Aug 6th: 0.15%
- gain on Yobit – Binance at 20:08 on Aug 6th: 0.13%
- gain on Binance – Yobit at 23:49 on Aug 6th: 0.17%
- gain on Yobit – Binance at 00:55 on Aug 7th: 0.18%
- gain on Binance – Yobit at 06:39 on Aug 7th: 0.12%
- gain on Yobit – Binance at 09:33 on Aug 7th: 0.33%
Important thing to remember here is that this analysis has been performed for the 0.75 LTC trade size. If the trade size would be bigger, arbitrage opportunities would be lower. In order to work around that, MultiTrader supportsaAdaptive auto rebalancing strategy, that will be the subject for another article. Basically instead of going “all-in”, MuliTrader just takes what is available – the size of each trade depends on how much is available and with what gain. It can do couple of buys in a row than single sell if it is available so it doesn’t need to stick to the rule that we have one “all-in” buy and then one “all-in” sell.
Example and analysis
We are starting with 0.01 BTC and 1 LTC on each exchange. We trade LTC for BTC or the opposite direction so that our overall sum of LTC and BTC is constantly growing. The amounts used for trades are calculated using the mid price. MultiTrader uses predefined value – parameter for the bot – as the amount of the transaction. In this case it is 0.75 LTC. Using the mid price, MultiTrader calculates the amount of BTC that should go into trade. To go into details of the operations that were performed in that arbitrage, please take a look at this diagram:
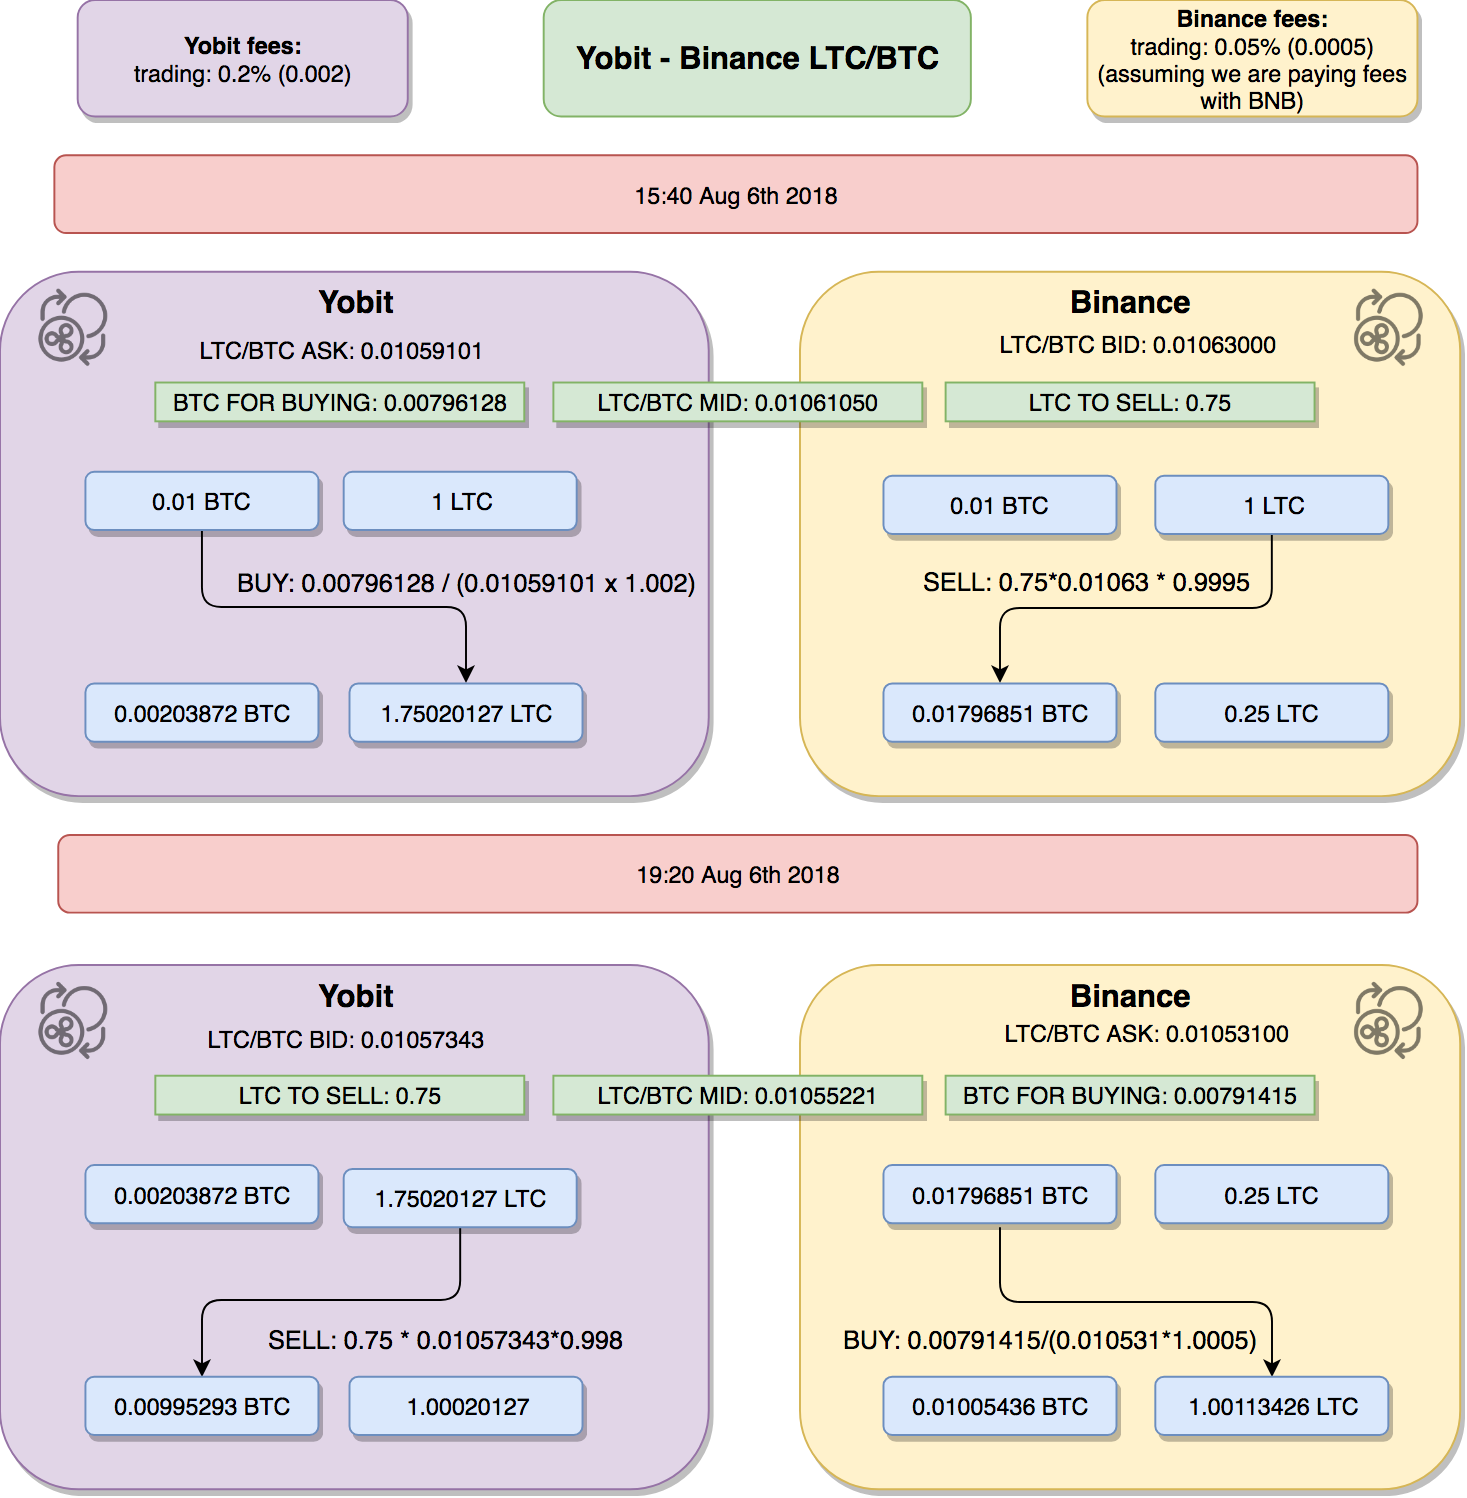
Here is the summary of our total funds across two exchanges at each point of time:

These are just first two steps from the original list above. As you can see our overall amount of BTC and LTC is growing at each step. What is worth noting, on Yobit our BTC amount has fallen below the starting point. The reason for this is that the price of LTC/BTC fluctuates and between 15:40 and 19:20 it has fallen. As MultiTrader calculates the amount of BTC based on the mid price with some constant amount of LTC, resulting amount of BTC taken for transaction at 19:20 was lower than the amount of the transaction at 15:40. This is not a reason to worry – overall we are all the time above our starting level. The fluctuations of the price happen both ways so after couple transactions, the balance will be restored.
In next part I am going to present next method called Spread Trading.


