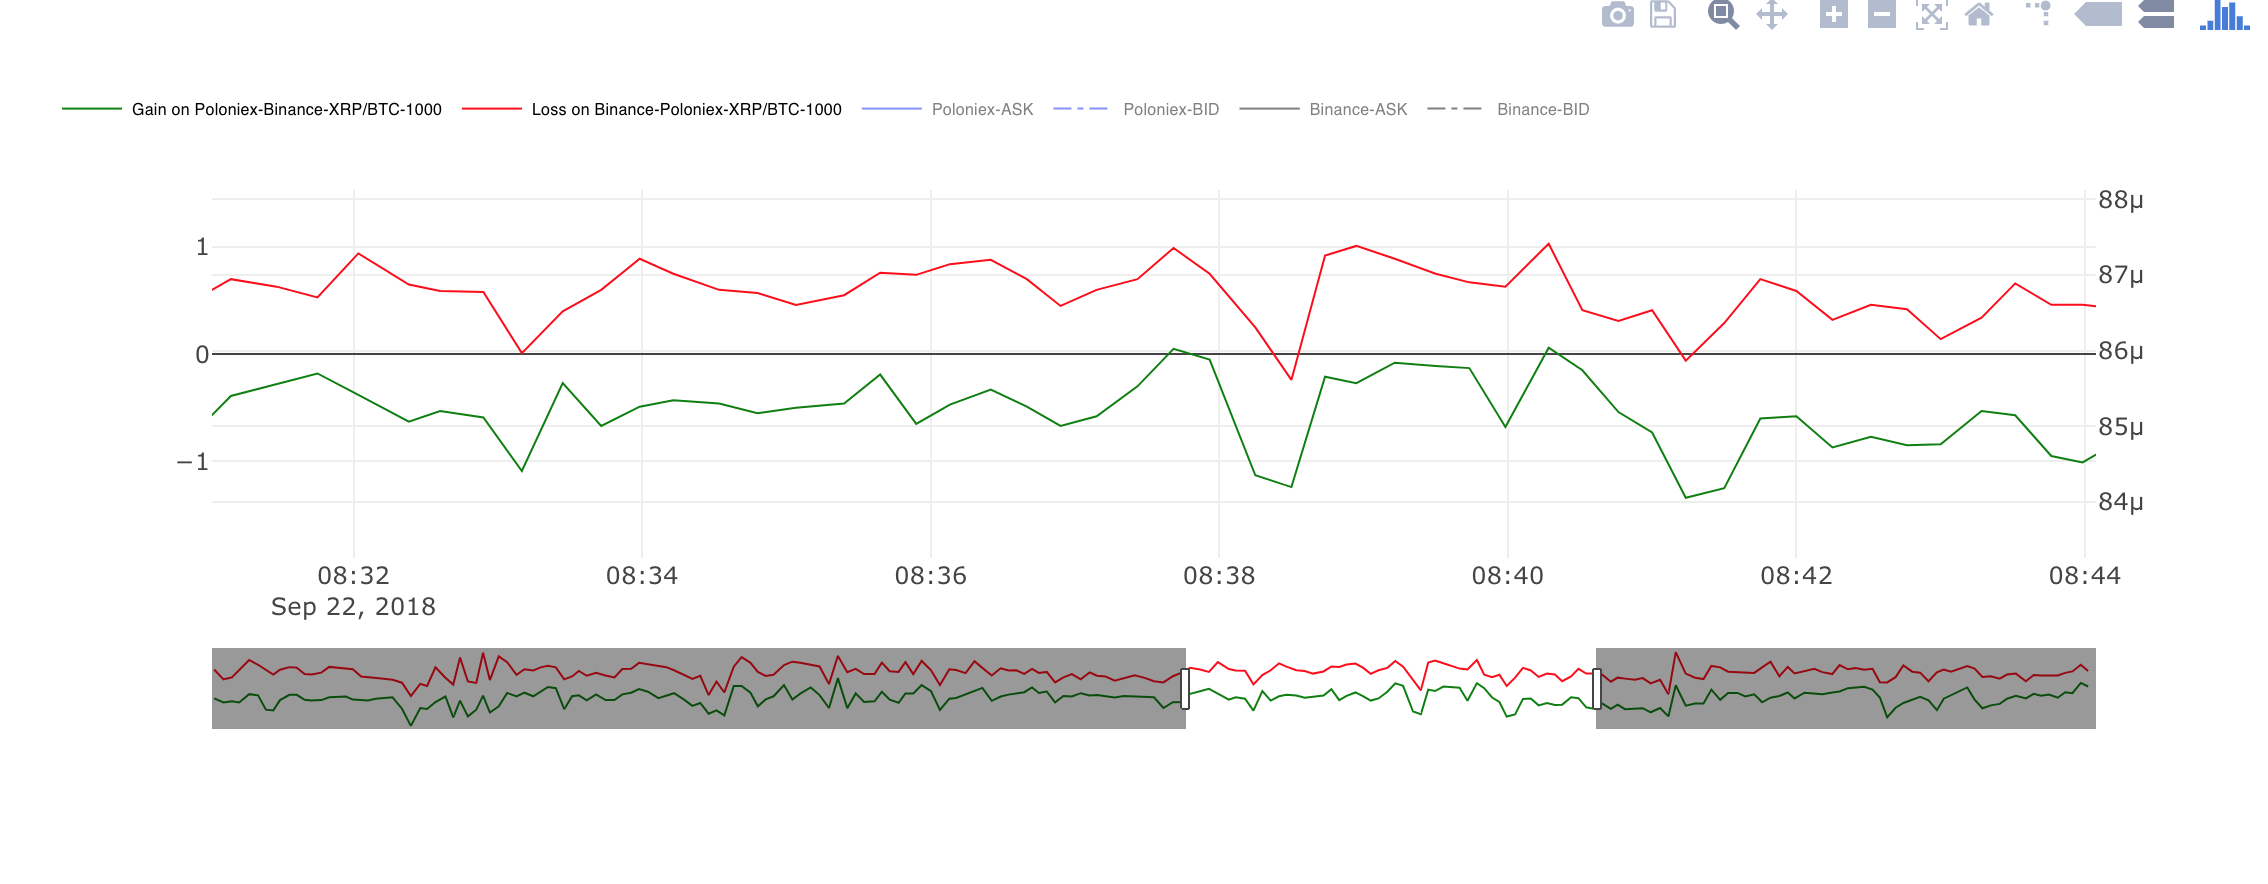
Until now the arbitrage analysis chart presented only the gain/loss from the arbitrage expressed in the percents of the invested sum. The chart looked like that:
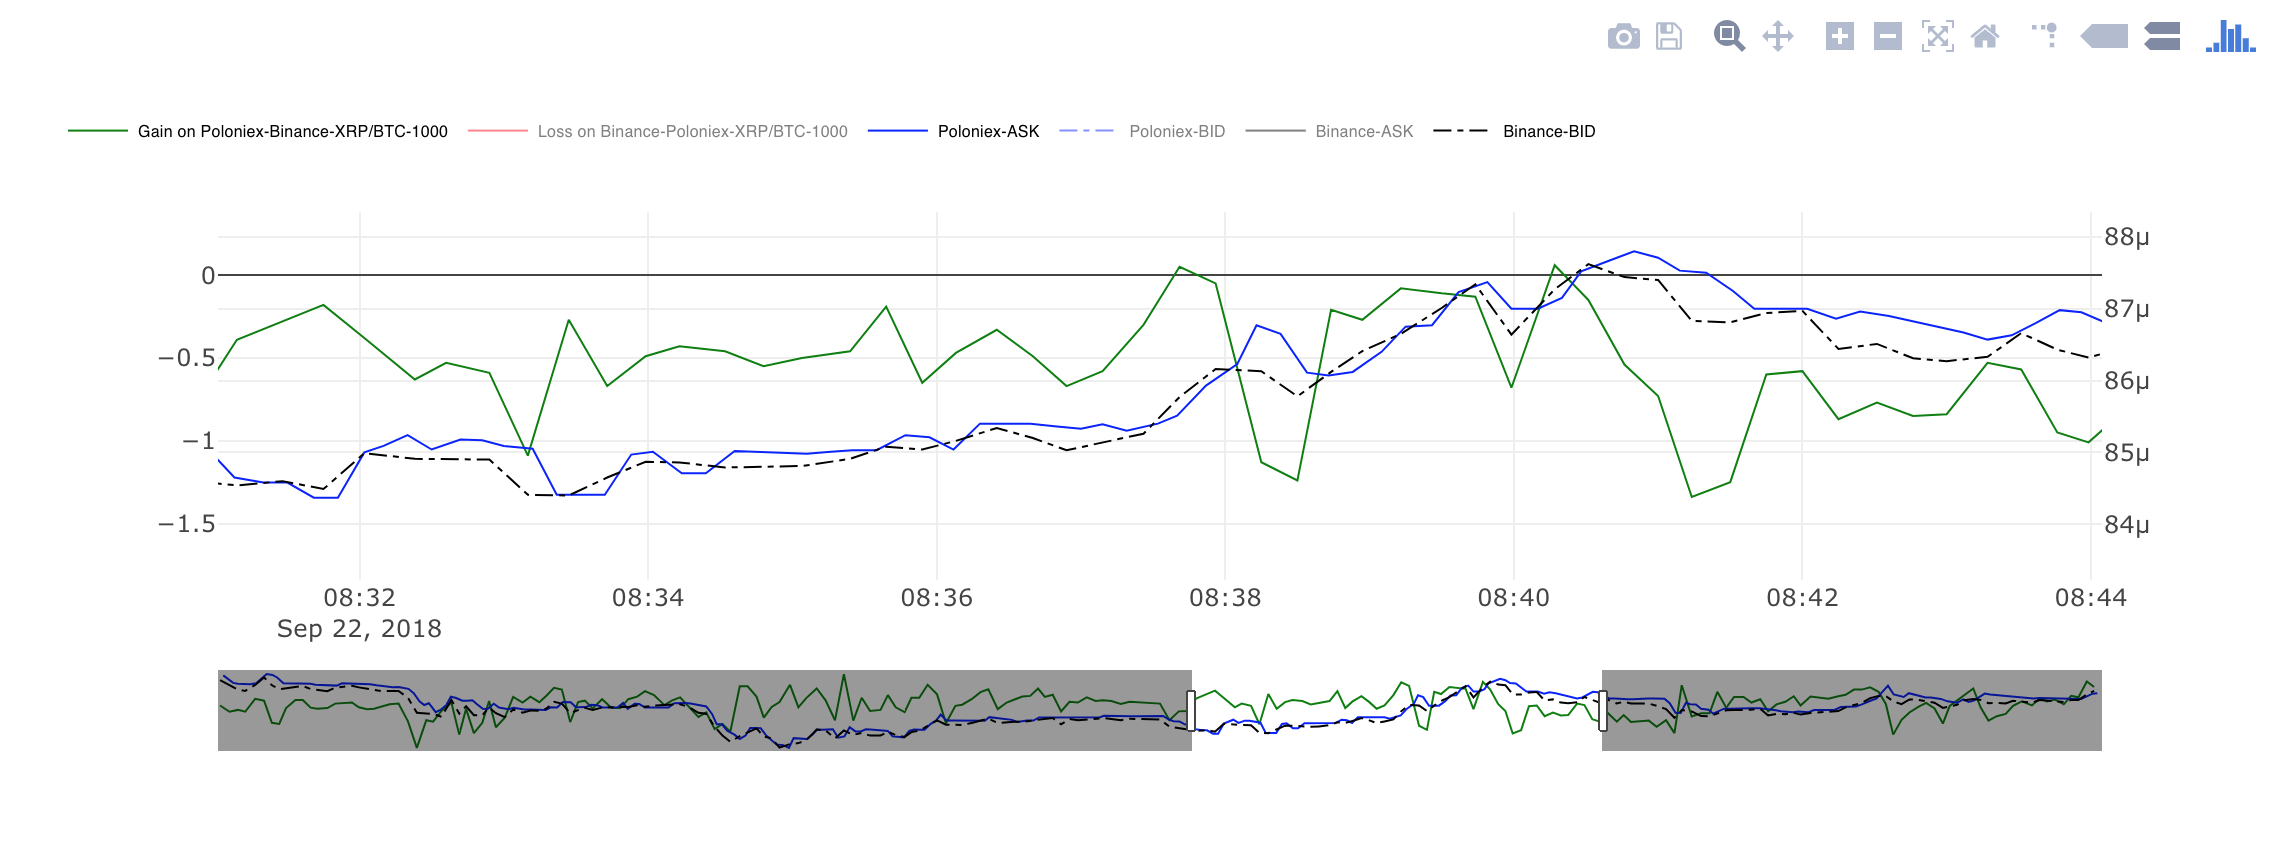
 What has been added: actual ticker values for BID/ASK on both exchanges. User can turn on/off lines by clicking on the legend. By default the ticker prices are hidden. Ticker prices have additional Y-axis on the right side, while left Y-axis corresponds to the gain curves.